

In modern finance, performance measurement is critical to survival and growth. Among the many financial metrics used by analysts and managers, the efficiency ratio stands out as a powerful indicator of how effectively an organization controls its costs relative to Revenue.
Whether in banking, corporate finance, or investment analysis, this ratio provides a clear view of operational effectiveness and financial discipline, helping stakeholders make informed decisions about the company’s ability to optimize its resources.
This comprehensive guide explores this metric in depth, including its definition, formulas, interpretation, industry applications, and strategic importance. By the end, you will understand how it functions as a cornerstone tool in evaluating financial health and operational performance.
| Section | Key Focus | Practical Importance |
| Definition | Measures expenses relative to Revenue | Indicates operational efficiency |
| Basic Formula | Operating Expenses ÷ Revenue | Evaluates overall business performance |
| Banking Formula | Non-Interest Expenses ÷ Net Revenue | Key metric for banks |
| Core Components | Operating Expenses & Revenue | Determines calculation accuracy |
| Interpretation | Low = efficient, High = inefficient | Guides benchmarking and decisions |
| Industry Benchmarks | Banks 50–60%, Retail higher, Tech lower | Enables fair comparisons |
| Practical Applications | Cost tracking, budgeting, automation | Supports strategy |
| Investor Use | Company comparison & management evaluation | Guides investment decisions |
| Risk Assessment | Rising ratio signals cost/Revenue issues | Identifies early risks |
| Limitations | Doesn’t measure profitability directly | Use with other ratios |
What Is Efficiency Ratio?

This financial indicator measures how effectively a company uses its expenses to generate Revenue. In simple terms, it shows how much a company spends to earn $1 in revenue.
Its general purpose is to evaluate:
- Cost management
- Operational productivity
- Profit generation capacity
- Financial stability
A lower value indicates better performance because it means the company is spending less to generate Revenue. Conversely, a higher number suggests operational inefficiencies.
Why It Matters in Modern Finance?
This ratio plays a central role in financial analysis because it connects operational performance with profitability.
Key Reasons It Matters
- Measures cost control
- Compares company performance over time
- Evaluates management effectiveness
- Supports investor decision-making
- Identifies operational weaknesses
Financial institutions, especially banks, rely heavily on this metric to measure operational strength.
Basic Formula
The simplest calculation is:
Ratio = Operating Expenses ÷ Revenue
This formula shows the proportion of Revenue consumed by operating expenses. It reveals how much a company spends to generate each dollar of Revenue, making it a direct indicator of cost control and productivity.
Banking Formula
In the banking industry, the calculation is slightly different:
Ratio = Non-Interest Expenses ÷ Net Revenue
Here, non-interest expenses include salaries, administrative costs, technology investments, and other overhead. Net Revenue consists of net interest income plus non-interest income, such as service fees. This version is widely used in banking because it focuses on operational costs relative to total income, enabling the evaluation of institutional efficiency.
Interpreting the Metric
Understanding how to interpret the ratio is essential.
What Is a Good Ratio?
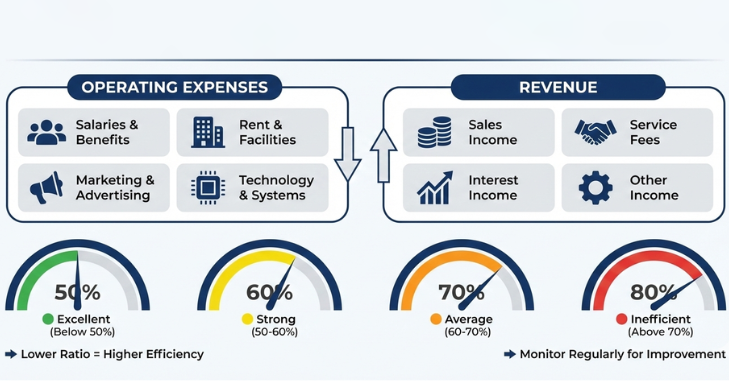
- Below 50% → Excellent operational performance
- 50–60% → Strong efficiency
- 60–70% → Average performance
- Above 70% → Operational inefficiency
For example, if a company has a 55% ratio, it spends 55 cents to generate $1 in Revenue.
Two Main Components

1. Operating Expenses
Operating expenses are the day-to-day costs required to run a business efficiently, including salaries, rent and utilities, administrative costs, marketing, and technology investments. Managing these costs effectively is crucial for maintaining a strong financial position.
2. Revenue
Revenue represents the total income generated from a company’s core activities. It may include sales income, service fees, interest income, and investment returns. Increasing Revenue while controlling operating expenses directly improves performance, making careful analysis essential for achieving better operational results and long-term financial success.
Importance in Banking
This metric is particularly significant in the banking industry. Banks operate with high overhead costs and regulatory requirements. Monitoring it helps:
- Control administrative expenses
- Optimize branch operations
- Improve digital banking strategies
- Enhance profitability
Lower values indicate stronger operational management.
Comparison With Other Financial Metrics
| Metric | What It Measures | Focus Area | Relation |
| This Ratio | Expense-to-revenue relationship | Operational performance | Direct cost indicator |
| Profit Margin | Net income as % of Revenue | Profitability | Influenced by operational costs |
| Return on Assets (ROA) | Net income relative to assets | Asset performance | Efficiency impacts returns |
| Cost-to-Income Ratio | Similar measure in banking | Expense management | Often interchangeable |
This table highlights how it connects with broader financial performance indicators.
Practical Applications
1. Internal Performance Monitoring
Companies use the ratio to evaluate operational health, track cost trends, improve workflows, and identify unnecessary expenses.
2. Investor Analysis
Investors analyze it to compare competitors, evaluate management quality, and assess long-term sustainability.
3. Strategic Planning
Executives rely on it for budgeting, cost-reduction programs, and automation initiatives. It helps align spending with revenue goals.
How to Improve
Optimization Strategies:
- Automating repetitive tasks
- Reducing administrative overhead
- Outsourcing non-core activities
- Increasing revenue streams
- Implementing digital transformation
The goal is either to reduce expenses, increase Revenue, or both.
Real-World Example
Consider a company with:
- Operating Expenses: $500,000
- Revenue: $1,000,000
Ratio = 500,000 ÷ 1,000,000 = 50%
This means the company spends 50 cents for every dollar earned, a strong performance indicator.
Limitations
While powerful, this metric has certain limitations:
- Does not measure profitability directly
- Can vary significantly by industry
- May not reflect one-time or extraordinary expenses
- Ignores long-term investments
- Should be used alongside other financial metrics for comprehensive analysis
Industry Benchmarks

Different industries use different efficiency ratios, which play a crucial role in assessing operational performance. For example, banks often consider a 50–60% ratio to be strong, reflecting the unique financial dynamics of the sector. In contrast, retail businesses generally aim for higher efficiency ratios to offset significant inventory and operational costs that affect profitability.
Meanwhile, technology firms typically exhibit lower ratios, thanks to their scalable business models that allow for streamlined operations and reduced costs. Understanding these benchmarks is essential for conducting accurate evaluations and making informed decisions in line with industry-specific norms.
Digital Transformation
Automation, AI, and cloud computing help companies:
- Reduce labor costs
- Streamline operations
- Increase scalability
Organizations embracing technology often see improvements in their operational ratios.
Risk Management
This metric is also critical in risk assessment. A rising ratio may indicate declining Revenue, poor expense management, or increased competitive pressure. Analysts monitor trends to identify early warning signs and mitigate risks.
Trends Affecting Operational Performance
- Globalization
- Regulatory compliance costs
- Inflation
- Technological disruption
- Remote workforce management
Adapting to these changes is crucial for maintaining strong performance.
Conclusion
This ratio is a key financial metric in modern finance. It measures how effectively a company converts expenses into Revenue and provides insight into operational performance, management quality, and financial health.
From formulas to applications in banking, corporate finance, and investment analysis, it remains central to performance evaluation. A lower value indicates better cost control, while a higher value may signal inefficiencies. When used with other metrics, it becomes a powerful tool for strategic decision-making. Understanding, monitoring, and improving it can transform financial outcomes and support long-term success.
If you want to read an interesting article about it, explore our Finance category.
FAQs
This ratio measures cost relative to Revenue, while profitability ratios (net margin, ROA) measure net profit after taxes and interest. They complement each other to provide a complete picture of performance.
Automation, AI, and cloud solutions reduce labor and operational costs, improving overall efficiency and scalability.
Yes. Short-term, it monitors costs and operational efficiency; long-term, it supports budgeting, automation, and scalability planning.
A rising ratio can signal declining Revenue, mismanaged expenses, or increased competitive pressure. Analysts track trends to identify early warning signs.